
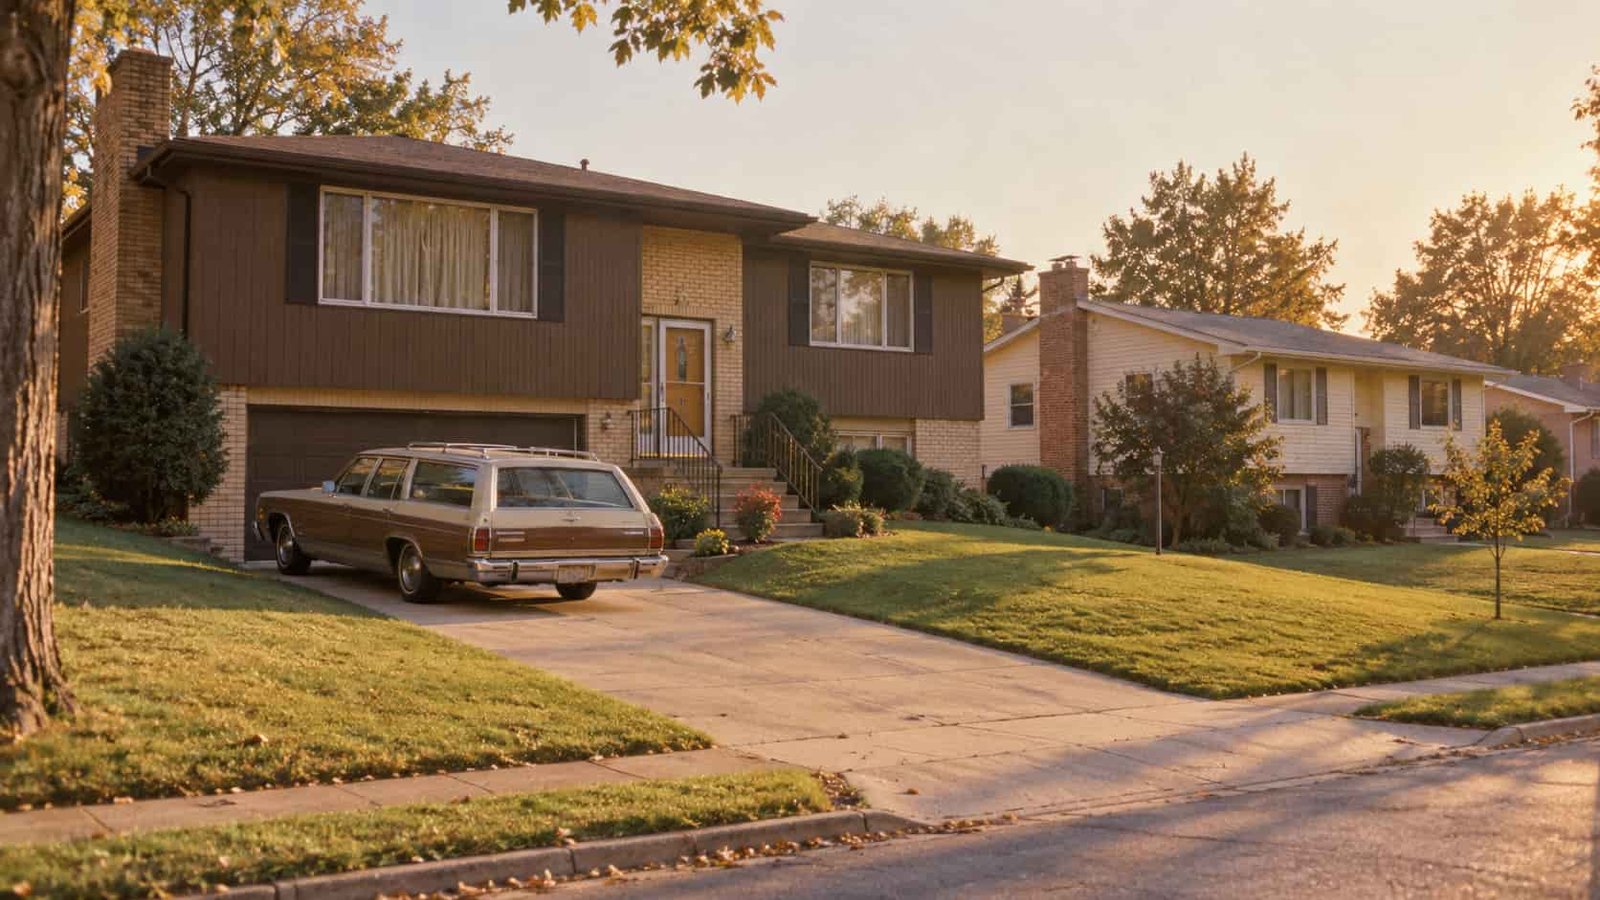
In 1970, the median price of a newly built home in the United States was $23,400. By 1979, it had reached $62,900. Even for a decade remembered for inflation, that was a remarkable rise.
Those prices look almost impossibly low today. A house for $25,000? A brand-new home for less than many new cars now cost?
But the number on the sales contract is only half the story. American families earned far less, mortgage rates climbed sharply, and the dollar itself lost purchasing power throughout the decade.
To understand what buying a home in the seventies was really like, we need to look beyond the old price tag.
House prices year by year
The U.S. Census Bureau has tracked the selling price of newly built homes for decades. Its historical series gives us a clear look at what happened during the 1970s.
| Year | Median price of a new home |
|---|---|
| 1970 | $23,400 |
| 1971 | $25,200 |
| 1972 | $27,600 |
| 1973 | $32,500 |
| 1974 | $35,900 |
| 1975 | $39,300 |
| 1976 | $44,200 |
| 1977 | $48,800 |
| 1978 | $55,700 |
| 1979 | $62,900 |
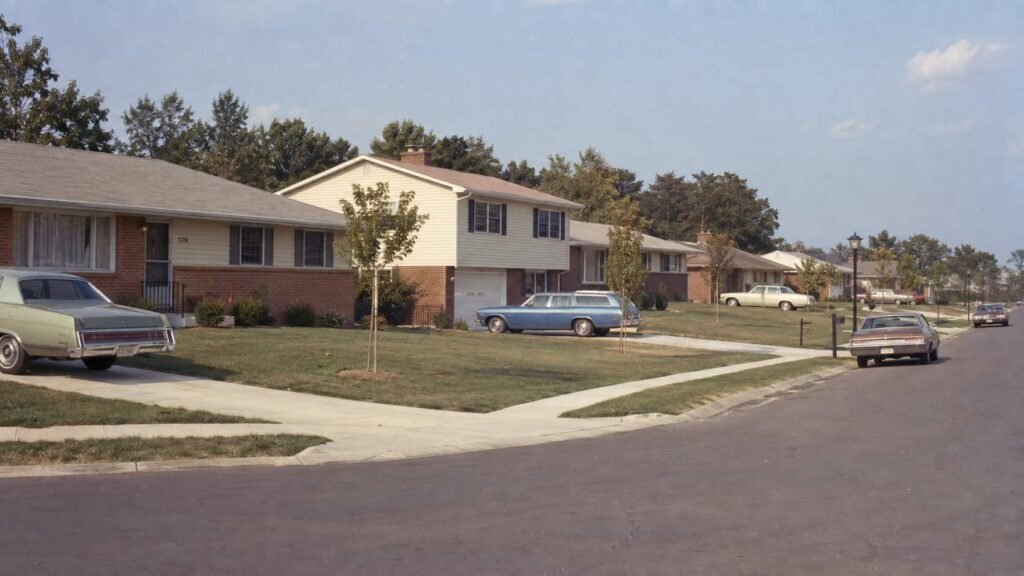
The pattern is hard to miss. At the beginning of the decade, a median-priced new home was still comfortably below $30,000. That changed quickly.
The median passed $30,000 in 1973, approached $40,000 by 1975 and was already above $55,000 in 1978.
From 1970 to 1979, the increase was about 169%.
What did a $23,400 house mean in 1970?
This is where old house prices become more interesting.
Median family income in 1970 was roughly $9,870 a year. The median price of a newly built home was therefore around 2.4 times median family income.
So while $23,400 sounds tiny from a modern perspective, it certainly wasn’t pocket change to a family living in 1970.
Think of the price in terms of paychecks rather than today’s dollars. A household earning around the national median would still be committing several years of gross income to the purchase of a new home.
By 1979, the math looked very different
Median family income had risen substantially by the end of the decade, reaching about $19,680 in 1979.
But new-home prices had risen even faster.
| 1970 | 1979 | |
|---|---|---|
| Median new-home price | $23,400 | $62,900 |
| Median family income | ≈ $9,870 | ≈ $19,680 |
| Home price / family income | ≈ 2.4× | ≈ 3.2× |
In other words, family income roughly doubled in nominal terms while the median new-home price rose much more sharply.
That doesn’t tell us everything about affordability — families, locations, taxes and individual houses varied enormously — but it does challenge the idea that anyone with an average salary could casually pick up a house for $25,000.
Then mortgage rates started climbing
There’s another reason the sticker price alone can be misleading: the cost of borrowing changed dramatically during the seventies.
Freddie Mac’s historical data puts the average conventional 30-year mortgage commitment rate at roughly 7.4% in 1972. By 1978 it was around 9.6%. In 1979, the annual average had climbed to roughly 11.2%.
That combination hurt buyers twice. Homes were getting more expensive, and financing those homes was becoming more expensive too.
As a simple illustration, imagine financing 80% of a median-priced new home over 30 years. At 1972’s approximate price and mortgage rate, principal and interest would be around $153 a month. Using the 1979 median price and roughly 11.2% rate, the same calculation comes to nearly $487 a month.
That’s only an illustration — it excludes taxes, insurance, points and other costs — but it shows how quickly the monthly mathematics changed.
A $25,000 home was perfectly believable early in the decade
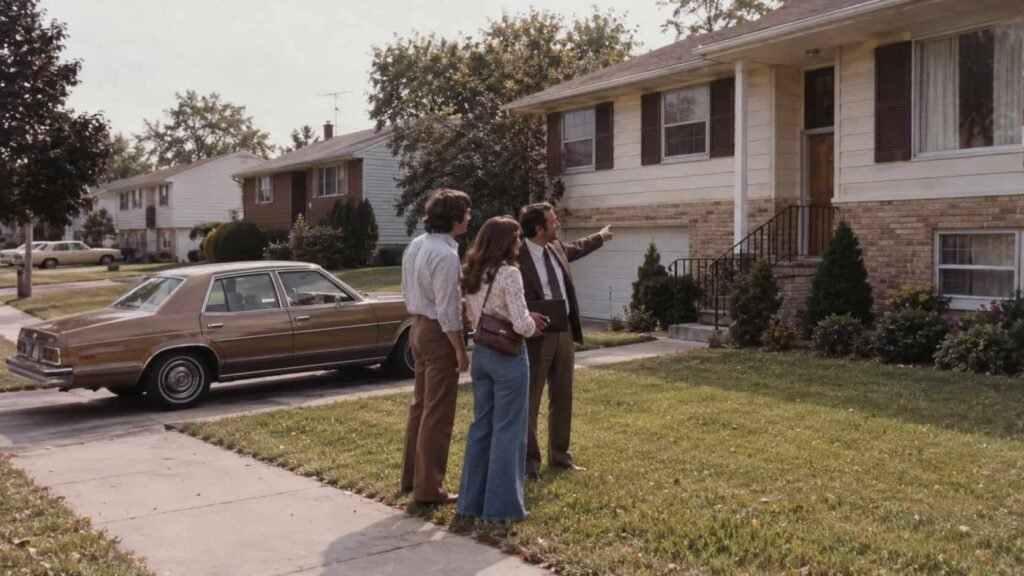
If you were flipping through real-estate listings in 1970 or 1971, a new home around $25,000 would not have seemed suspiciously cheap.
The national median was $23,400 in 1970 and $25,200 the following year.
Of course, national medians hide huge differences. A modest house in a smaller town could sell for considerably less. Homes in desirable suburbs or expensive metropolitan areas could cost much more.
And these Census figures specifically measure newly built homes sold. They aren’t a price list for every existing house in America.
What kind of house were buyers getting?
The seventies suburban landscape was full of houses that now instantly look like the era: ranch homes, split-levels, attached garages, wide driveways and increasingly established postwar subdivisions.
Step through the front door and the decade became even more obvious.
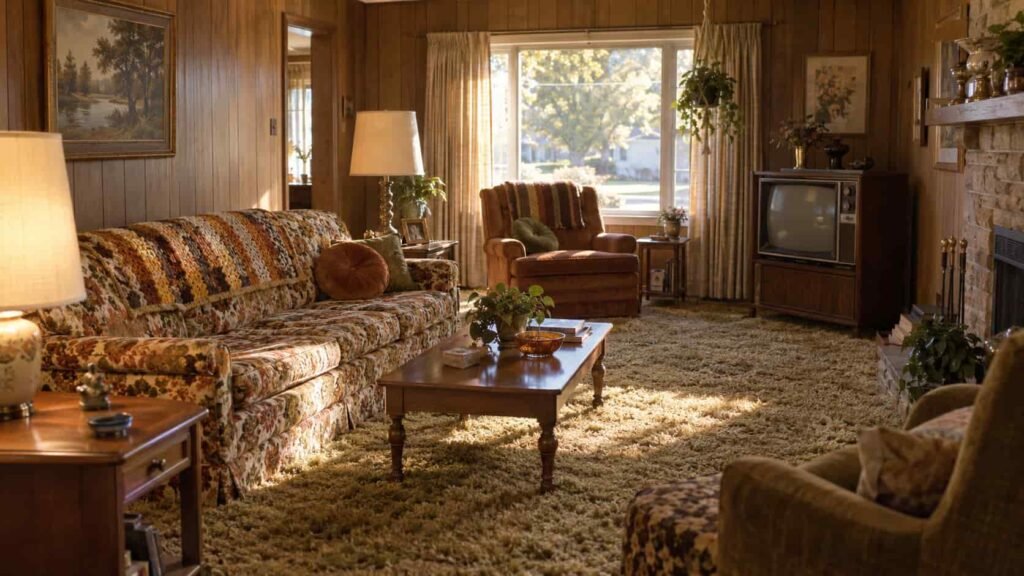
Wood paneling, patterned wallpaper, shag carpeting, earth tones and kitchens filled with brown, orange, harvest gold or avocado green all found their way into American homes during the period.
Some of those choices eventually became punchlines. Today, they’re a large part of what makes an untouched seventies interior so instantly recognizable.
1973 was an early turning point
The table also reveals how quickly prices accelerated before the decade was even half over.
The median new-home price went from $27,600 in 1972 to $32,500 in 1973 — a jump of almost $5,000 in a single year.
By 1976, the median stood at $44,200. Just four years earlier, it had still been below $28,000.
For someone who delayed buying a home during those years, the target could feel like it was moving surprisingly fast.
And then came the late-seventies squeeze
By 1978 and 1979, Americans were dealing with a very different housing market from the one that had opened the decade.
The median new-home price was $55,700 in 1978 and $62,900 in 1979. Mortgage rates were climbing into double digits. Inflation was affecting everyday purchases well beyond housing.
The famously punishing mortgage rates of the early 1980s were still ahead, but the conditions that made them possible were already visible.
Would you have guessed $62,900?
Historical prices become much harder when you don’t already know the answer.
Put a 1979 house next to a television set, a new car, a gallon of gas and a week’s groceries, and our sense of what each item “should” cost starts to fall apart surprisingly quickly.
So, how much did a house cost in the 1970s?
If you want one simple answer, a newly built American home had a median selling price of $23,400 in 1970, $39,300 in 1975 and $62,900 in 1979.
But those three numbers tell an even better story when they’re placed beside wages and mortgage rates. The seventies didn’t simply begin with “cheap houses.” They were a decade in which the cost of buying and financing a home changed at extraordinary speed.
And somewhere behind those numbers was a new homeowner picking out shag carpet, deciding whether avocado green really worked in the kitchen, and hoping interest rates wouldn’t climb any higher.
